Dec 23, 2015

RowNumber in SSRS

RowNumber returns a sequential number to every row within the specified scope.

Synatax
RowNumber(Scope)

Parameter
Scope: The name of dataset, data region or group or null/nothing. Based on scope it resets the row count to 1. If scope is defined as nothing it will assign each row a unique number and will be equal to the number of rows.

Similar function in SQL Server:  Row_Number in SQL

Example
Let's create a report and see how RowNumber works. For this, we will continue on a Tabular Report we created in an earlier article.

Step 1: Create a simple Tabular Report
First Create a simple Tabular Report using above link. Reports look like this

Tabular Report

Once report is created we would generate Row Number to the report.

Step 2: Right Click on Department Column Header and add a column to its Left and name the Column Header as S.No

Add Column

S.No Column

Step 3: Right Click on S.No Data Column and click Expression.

Add Expression

Step 4: In the Expression window, set expression value as =RowNumber(Nothing) and click Ok

Set Expression

Step 5: Here we have defined the scope as Nothing, so it will generate a unique RowNumber to the result-set. Let's run the report and see the output.

Report Output

Check the output, we have a column S.No with unique Row Number (S.No) in the output.

Now let's change the scope of RowNumber to a Group.

Step 6: Right click Data Region, Then Add Group>Parent Group and add GroupName as Group

Add Group

GroupName

This will add a new column Group Name to the report.

Group Name Column

Right click and Delete the newly created Group Name Column. While deleting it will prompt two options. Select Delete columns only. Add a new Column S.No by GroupName to the right of S No Column

Add Column
Step 7: Right click the new Data Column S No By GroupName and click Expression. Set the expression to =RowNumber("GroupName")

Set Expression


Step 8: Now we have defined the scope as GroupName, so S.No by GroupName should be reset to 1 for each GroupName. Let's run the report and check the output

Report Output

Check S.No by GroupName column where RowNumber is starting with 1 for each GroupName.

Similar function in T-SQL:  Row_Number in SQL

Ever created art by using an AI? Now you can with tools like Disco Diffusion, an AI that generates art. Rent GPU from RunPod and start your journey on learning and managing AI models.
Dec 15, 2015

Sub Report in SSRS

In this article, I am going to demonstrate step by step example of creating Sub Report in SSRS.

Sub Reports are generally used when we need to show detail data with respect to summary data.

Example
Show Detail Data of Sales with respect to its Sales Header Data
  • Main Report will display Sales Header Data
  • Sub Report will display Sales Detail Data
Prerequisites
Basic steps to create Sub Report
  • Create a Main Report
  • Create a Sub report 
  • Apply Filter Parameter on Sub Report
  • Insert Sub Report into Main Report
  • Connect reports using Parameter(s)

Now lets have step by step example

Step 1: Create a Main Report
  • Create a connection with SQL Server. We would be using shared data source to fetch the data from the database for the report we created in an earlier article. Create a Shared Data Source
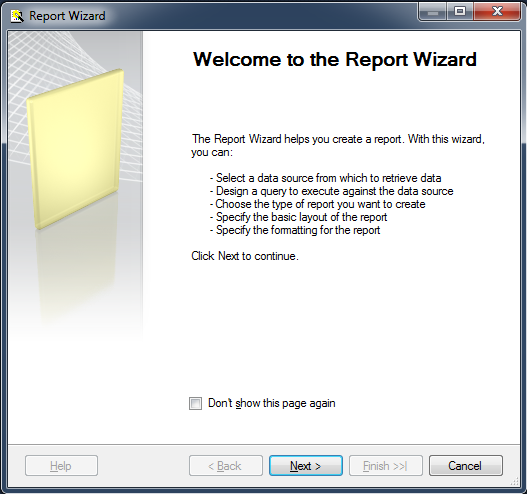
  • Right Click Reports>Add New Report, Report Wizard will appear to configure the report. Click Next

Add New Report

  • Configure Data Source. Select the Shared Data Source we created in Step 1 and Click Next

Select the Data Source

  • Design Query either thru Query Builder or write your own query and Click Next.
SELECT  SalesOrderID, OrderDate, SOH.CustomerID, P.FirstName+' '+P.LastName as CustomerName
        , SOH.SubTotal, SOH.TaxAmt, SOH.Freight,  SOH.TotalDue
FROM    Sales.SalesOrderHeader SOH
inner join Sales.Customer C on C.CustomerID = SOH.CustomerID
inner join Person.Person P on P.BusinessEntityID = C.PersonID
WHERE    SOH.OrderDate = @OrderDate

Design the Query

  • Select Tabular as Report Type and click Next.

Select the Report Type

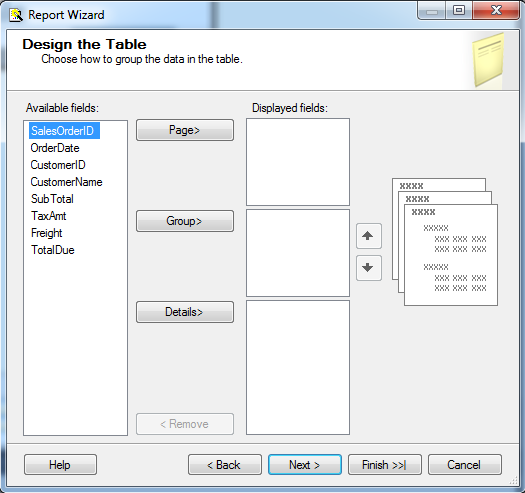
  • You can configure to display the data based on grouping but as of now just click Finish.

Design the Table

  • Here, you can select Table Style. Default Style is Slate. Click Next

Choose the Table Style

  • At this stage, we are done with configuration of Main Report. Change the Report Name to DailySalesReport and Click Finish.

Set Report Name

Main Report

  • Query Parameter OrderDate that we used in the Query in Step 4. will be created automatically. Change the Data Type to Date/Time

Add Query Parameter


Step 2: Create a Sub Report

  • Create another report that would be used as Sub Report using the same step we used to create Main Report using below Query. Name the Report to SalesDeails.
SELECT  SOD.SalesOrderID, SalesOrderDetailID, P.Name
        , P.ProductNumber, SOD.UnitPrice, SOD.OrderQty
FROM    Sales.SalesOrderHeader SOH
inner join Sales.SalesOrderDetail SOD on SOH.SalesOrderID = SOD.SalesOrderID
inner join Production.Product P on SOD.ProductID = P.ProductID

Sub Report


Step 3: Add Filter Parameter to Sub Report

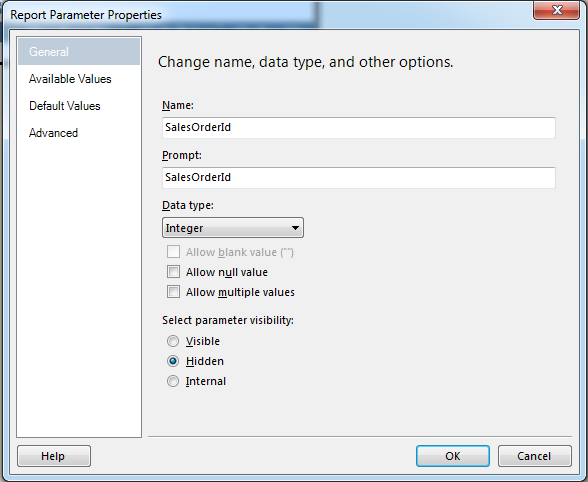
  • Add Parameter SalesOrderId to Sub Report.
  • Set Data type as Integer and Parameter visibility to Hidden as this would be automatically passed from Main Report to Sub Report.

Add Parameter

  • Right Click on Dataset>Datset Properties under Report Data

Dataset Properties

  • In Dataset Properties Windows select Filters Tab and Add Filter SalesOrderDetailId

Add Filter


Step 4: Insert Sub Report into Main Report

  • Add a group to the Data Section

Add Group

  • Merge all the cells


  • Right Click on the Group and select Insert>Subreport

Insert Sub Report

Insert Sub Report

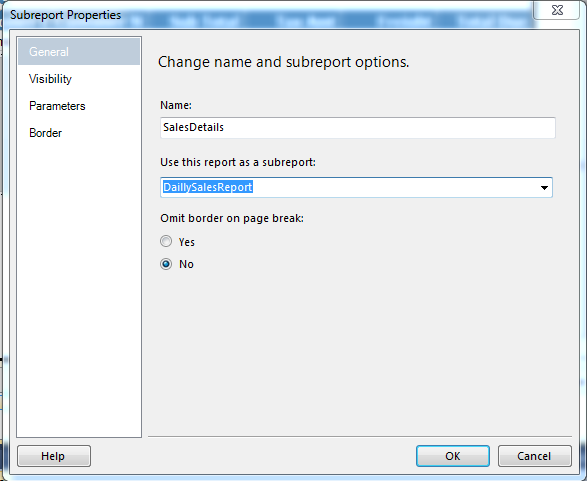
  • Right Click SubReport Section > Sub Report Properties. In the pop window change the Name of Sub Report to SalesDetails and select DailySalesReport as below.
Name the Sub Report

Step 5: Connect reports using Parameter(s)

  • Select Parameters Tab and Add Parameter as below

Add Parameter

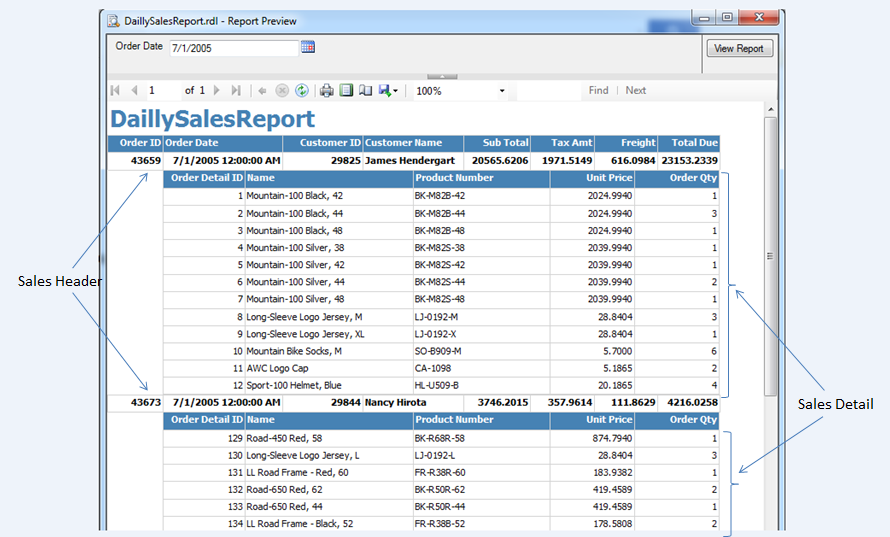
We are done with creating the Sub Report. Now lets run the report and see the output.


Nov 24, 2015

New Features in SQL Server 2016

Always Encrypted

Always Encrypted feature is designed to protect the data. With this feature enabled data is always be encrypted within SQL Server. Access to encrypted data is only available to the applications calling SQL Server.  This enables client application owners to control who gets access to see their applications confidential data.  It does this by allowing the client application to be the one that has the encryption key. That encryption key is never passed to SQL Server. Encryption and decryption of data happens transparently inside the application. This means the data stored in SQL Server will be encrypted which can secure it from DBA and administrators but that also has considerations for ad-hoc queries, reporting and exporting the data.

PolyBase

PolyBase allows you to query distributed data sets. With this feature you will be able to use T-SQL statements to query Hadoop or SQL Azure blob storage. By using PolyBase you can now write adhoc queries to join relational data from SQL Server with semi-structured data stored in Hadoop, or SQL Azure blob storage.  This allows you to get data from Hadoop without knowing the internals of Hadoop.  Additionally you can leverage SQL Server’s on the fly column store indexing to optimize your queries against semi-structured data. As organizations spread data across many distributed locations, PolyBase will be a solution for them to leverage SQL Server technology to access their distributed semi-structured data.

JSON Support

JSON stands for Java Script Object Notation. JSON (JavaScript Object Notation) is a standardized data exchange format that is currently not supported natively by SQL Server. With JSON Support now you can interchange JSON data between applications and the SQL Server database engine. By adding this support Microsoft has provided SQL Server the ability to parse JSON formatted data so it can be stored in a relation format. Additionally, with JSON support you can take relational data, and turn it into JSON formatted data.  Microsoft has also added some new functions to provided support for querying JSON data stored in SQL Server. Having these additional JSON features built into SQL Server should make it easier for applications to exchange JSON data with SQL Server

Multiple TempDB Database Files

It has been a best practice for a while to have more than one tempdb data file if you are running on a multi-core machine.  In the past, up through SQL Server 2014, you always had to manually add the additional tempdb data files after you installed SQL Server. With SQL Server 2016 you can now configure the number of tempdb files you need while you are installing SQL Server.  Having this new feature means you will no longer need to manually add additional tempdb files after installing SQL Server.

Query Store

One common problem many organizations face when upgrading versions of SQL Server is changes in the query optimizer (which happen from version to version) negatively impacting performance. Without comprehensive testing, this has traditionally been a hard problem to identify and then resolve. The Query Store feature maintains a history of query execution plans with their performance data, and quickly identifies queries that have gotten slower recently, allowing administrators or developers to force the use of an older, better plan if needed. The Query Store is configured at the individual database level.

Row Level Security

A feature that other databases have had for many years, and SQL Server has lacked natively is the ability to provide row-level security (RLS). This restricts which users can view what data in a table, based on a function. SQL Server 2016 introduces this feature, which is very useful in multi-tenant environments where you may want to limit data access based on customer ID. I've seen some customized implementations of RLS at clients in the past, and they weren't pretty. It is hard to execute at scale. The implementation of RLS in SQL 2016 still has it limits (updates and inserts are not covered), but it is good start on a much-needed feature.

Temporal Table

A temporal table is table that holds old versions of rows within a base table.  By having temporal tables SQL Server can automatically manage moving old row versions to the temporal table every time a row in the base table is updated.  The temporal table is physically a different table then the base table, but is linked to the base table.  If you’ve been building or plan to build your own method to managing row versioning then you might want to check out the new temporal tables support in SQL server 2016 before you go forth and build your own row versioning solution.

Nov 18, 2015

Matrix Report in SSRS

In this tutorial, we are demonstrating step by step example of creating a simple Matrix Report in SSRS.

Need of Matrix Report?
Matrix Reports are required where you have to display some aggregated data and at least one of grouping column need to displayed as column in the report. It is something similar to Pivot we use in normal T-SQL where we convert rows to columns using Pivot.

Now let's have a walk-through of a Matrix Report

Example:
We will create a matrix report where sum of sales will be displayed Year and Product wise in a matrix form and Year will be displayed as columns (similar to pivot in SQL)

We would be using Shared Data source we created in previous article: Shared Data Source

Step 1: Create a Shared Data Source
We would be using this shared data source to fetch the data from the database for the report.

Step 2: Right Click Reports>Add New Report, Report Wizard will appear to configure the report. Click Next.

Add New Report

Step 3: Configure Data Source. Select the Shared Data Source we created in Step 1 and Click Next

Configure Data Source

Step 4: Design Query either thru Query Builder or write your own query and Click Next.
select  P.ProductNumber, P.Name as ProductName
        , YEAR(SOH.OrderDate) as Year, SOD.LineTotal as SaleAmount
from    Sales.SalesOrderDetail SOD
inner join Sales.SalesOrderHeader SOH on SOH.SalesOrderID = SOD.SalesOrderID
inner join Production.Product P on P.ProductID = SOD.ProductID

 Design Query

Step 5: Select Matrix as Report Type and click Next.

Report Type


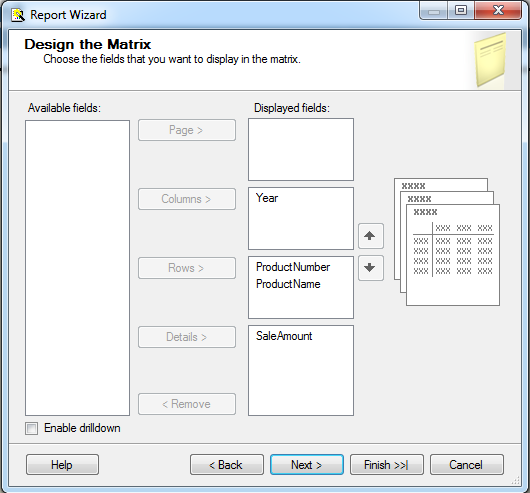
Step 6: All available field will be displayed in Available fields Section. Configure the fields like below by clicking on Columns, Rows & Details buttons respectively.
  • Year Field moved to Columns as it is to be displayed as Column 
  • ProductNumber & ProductName Fields moved to Rows as they are to be displayed as Rows 
  • SalesAmount to Details as it is to be aggregated based on Year and Product. 
Once Configured Click Next

Matrix

Step 7: Here, you can select Table Style. Default Style is Slate. Click Next

Table Style

Step 8: At this stage, we are done with configuration of reports. Change the Report Name to YearProductWiseSale and Click Finish.

Report Name

Step 9: Click Finish will create a report. You can configure design part like color, height, width etc..manually

Design Report

We are done with creating a Simple Matrix Report.  Let's run the report and see the output.

To run the report, set this report as StartItem in Project Properties.

Right Click Project>Properties. Select the report we just created as StartItem.

StartItem

Now let's run the project and see the output of the report

Report Output

Nov 15, 2015

Query Parameter in SSRS

Query Parameters are used to filter the result set return from the database similar to where condition applied in a T-SQL statement. It limits the number of rows return back from the database to the report, thus improving the performance.

Let's create a report to see how Query Parameters work.

For this, we will  apply Query Parameter on a Tabular Report we created in an earlier article.

Step 1: Create a simple Tabular Report
First Create a simple Tabular Report using above link. Once report is created we would apply Query Parameters on the report

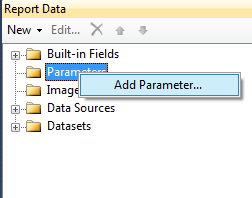
Step 2: On Report Data Tab, Click Parameters>Add Parameter

Add Parameter

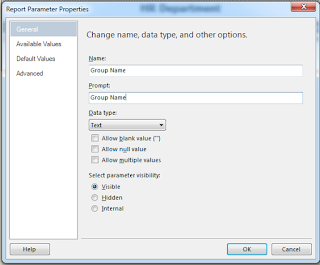
Configure Report Parameter Properties as below and click OK

Parameter Properties

Step 3: This will add GroupName Parameter under Parameters like below.

Parameter
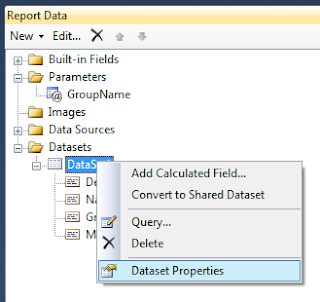
Step 4: Now let's apply the Parameter on DataSet to filter the result-set. In Report Data Tab right click DataSet1 under Datasets and then click Dataset Properties

Apply Parameter on Dataset

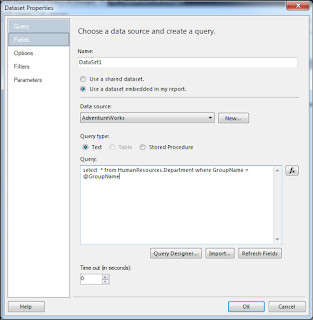
Step 5: In Query Tab under Dataset Properties, change the Query to
select  * from HumanResources.Department where GroupName = @GroupName
Set Query

Step 6: Select Parameters Tab, you will find Parameter Name @GroupName that we added in the query in Where clause in previous Step. Select Parameter Value as @GroupName from the list (created in step 3) and click OK

Set Parameter

Step 7: At this step we are done with adding Query Parameter to the Report. Now let's build the Solution and run the report. The Parameter Group Name that we created started appearing in the report to filter the result set. Enter Manufacturing in the text-box and click View Report

Report Output

Look at the output, the report is filtered with Group Name as Manufacturing

Nov 14, 2015

Creating Tabular Report in SSRS

In this tutorial, we will create a Simple Tabular Report in SSRS.

We would be using Shared Data source we created in previous article: Shared Data Source

Step 1: Create a Shared Data Source
We would be using this shared data source to fetch the data from the database for the report.

Step 2: Right Click Reports and then Add New Report, Report Wizard will appear to configure the report. Click Next

Add Report

Step 3: Configure Data Source. Select the Shared Data Source we created in Step 1 and Click Next

Configure Data Source

Step 4: Design Query either thru Query Builder or write your own query and Click Next.
select  * from HumanResources.Department

Design Query

Step 5: Select Tabular as Report Type and click Next.

Report Type

Step 6: You can configure to display the data based on grouping but as of now we are working on a simple tabular report, so just click Finish.

Table

Step 7: Here, you can select Table Style. Default Style is Slate. Click Next

Table Style

Step 8: At this stage, we are done with configuration of reports. Click Finish.

Report Name

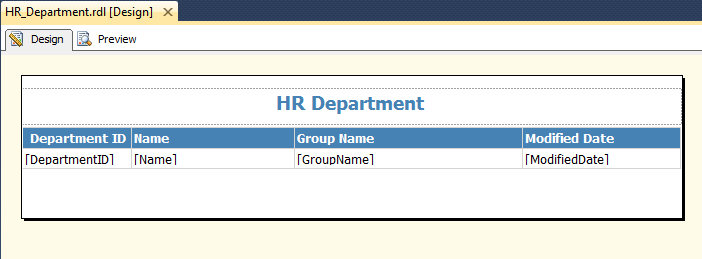
Step 9: Click Finish will create a report. You can also configure color, height, width etc..manually

Desing Report

We are done with creating a Simple Tabular Report.

To run the report, set this report as StartItem in Project Properties.

Right Click Project>Properties. Select the Report we just created as StartItem.

StartItem

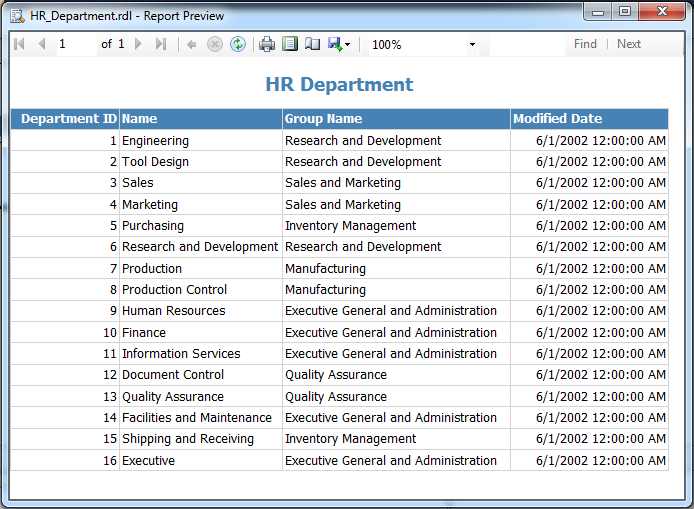
Now let's run the project and see the output of the report

Report Output