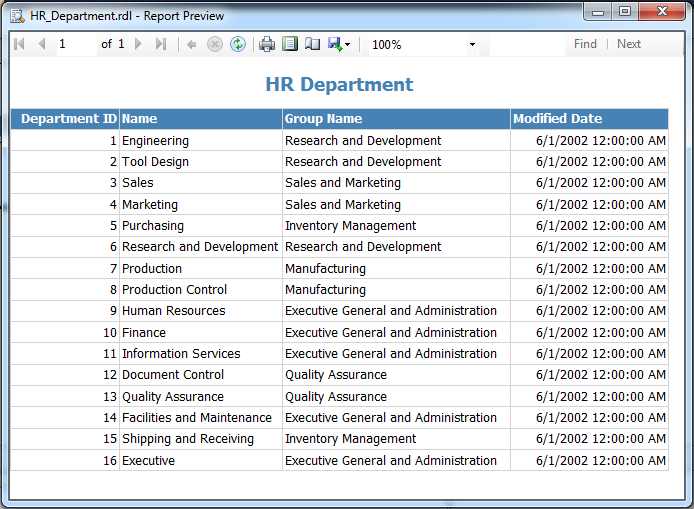
In this tutorial, we will create a Simple Tabular Report in SSRS.
We would be using Shared Data source we created in previous article: Shared Data Source
Step 1: Create a Shared Data Source
We would be using this shared data source to fetch the data from the database for the report.
Step 2: Right Click Reports and then Add New Report, Report Wizard will appear to configure the report. Click Next
Step 3: Configure Data Source. Select the Shared Data Source we created in Step 1 and Click Next
Step 4: Design Query either thru Query Builder or write your own query and Click Next.
Step 5: Select Tabular as Report Type and click Next.
Step 6: You can configure to display the data based on grouping but as of now we are working on a simple tabular report, so just click Finish.
Step 7: Here, you can select Table Style. Default Style is Slate. Click Next
Step 8: At this stage, we are done with configuration of reports. Click Finish.
Step 9: Click Finish will create a report. You can also configure color, height, width etc..manually
We are done with creating a Simple Tabular Report.
To run the report, set this report as StartItem in Project Properties.
Right Click Project>Properties. Select the Report we just created as StartItem.
Now let's run the project and see the output of the report
We would be using Shared Data source we created in previous article: Shared Data Source
Step 1: Create a Shared Data Source
We would be using this shared data source to fetch the data from the database for the report.
Step 2: Right Click Reports and then Add New Report, Report Wizard will appear to configure the report. Click Next
Step 3: Configure Data Source. Select the Shared Data Source we created in Step 1 and Click Next
Step 4: Design Query either thru Query Builder or write your own query and Click Next.
select * from HumanResources.Department
Step 5: Select Tabular as Report Type and click Next.
Step 6: You can configure to display the data based on grouping but as of now we are working on a simple tabular report, so just click Finish.
Step 7: Here, you can select Table Style. Default Style is Slate. Click Next
Step 8: At this stage, we are done with configuration of reports. Click Finish.
Step 9: Click Finish will create a report. You can also configure color, height, width etc..manually
We are done with creating a Simple Tabular Report.
To run the report, set this report as StartItem in Project Properties.
Right Click Project>Properties. Select the Report we just created as StartItem.
Now let's run the project and see the output of the report


No comments:
Write Comments