RowNumber returns a sequential number to every row within the specified scope.
Synatax
Parameter
Scope: The name of dataset, data region or group or null/nothing. Based on scope it resets the row count to 1. If scope is defined as nothing it will assign each row a unique number and will be equal to the number of rows.
Similar function in SQL Server: Row_Number in SQL
Example
Let's create a report and see how RowNumber works. For this, we will continue on a Tabular Report we created in an earlier article.
Step 1: Create a simple Tabular Report
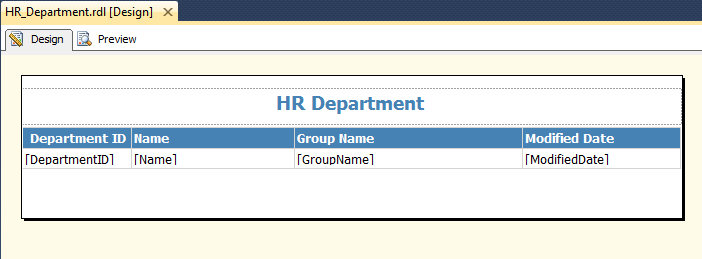
First Create a simple Tabular Report using above link. Reports look like this
Once report is created we would generate Row Number to the report.
Step 2: Right Click on Department Column Header and add a column to its Left and name the Column Header as S.No
Step 3: Right Click on S.No Data Column and click Expression.
Step 4: In the Expression window, set expression value as =RowNumber(Nothing) and click Ok
Step 5: Here we have defined the scope as Nothing, so it will generate a unique RowNumber to the result-set. Let's run the report and see the output.
Check the output, we have a column S.No with unique Row Number (S.No) in the output.
Now let's change the scope of RowNumber to a Group.
Step 6: Right click Data Region, Then Add Group>Parent Group and add GroupName as Group
This will add a new column Group Name to the report.
Right click and Delete the newly created Group Name Column. While deleting it will prompt two options. Select Delete columns only. Add a new Column S.No by GroupName to the right of S No Column
Step 7: Right click the new Data Column S No By GroupName and click Expression. Set the expression to =RowNumber("GroupName")
Step 8: Now we have defined the scope as GroupName, so S.No by GroupName should be reset to 1 for each GroupName. Let's run the report and check the output
Check S.No by GroupName column where RowNumber is starting with 1 for each GroupName.
Similar function in T-SQL: Row_Number in SQL
Synatax
RowNumber(Scope)
Parameter
Scope: The name of dataset, data region or group or null/nothing. Based on scope it resets the row count to 1. If scope is defined as nothing it will assign each row a unique number and will be equal to the number of rows.
Similar function in SQL Server: Row_Number in SQL
Example
Let's create a report and see how RowNumber works. For this, we will continue on a Tabular Report we created in an earlier article.
Step 1: Create a simple Tabular Report
First Create a simple Tabular Report using above link. Reports look like this
Once report is created we would generate Row Number to the report.
Step 2: Right Click on Department Column Header and add a column to its Left and name the Column Header as S.No
Step 3: Right Click on S.No Data Column and click Expression.
Step 4: In the Expression window, set expression value as =RowNumber(Nothing) and click Ok
Step 5: Here we have defined the scope as Nothing, so it will generate a unique RowNumber to the result-set. Let's run the report and see the output.
Check the output, we have a column S.No with unique Row Number (S.No) in the output.
Now let's change the scope of RowNumber to a Group.
Step 6: Right click Data Region, Then Add Group>Parent Group and add GroupName as Group
This will add a new column Group Name to the report.
Right click and Delete the newly created Group Name Column. While deleting it will prompt two options. Select Delete columns only. Add a new Column S.No by GroupName to the right of S No Column
Step 7: Right click the new Data Column S No By GroupName and click Expression. Set the expression to =RowNumber("GroupName")
Step 8: Now we have defined the scope as GroupName, so S.No by GroupName should be reset to 1 for each GroupName. Let's run the report and check the output
Check S.No by GroupName column where RowNumber is starting with 1 for each GroupName.
Similar function in T-SQL: Row_Number in SQL
Ever created art by using an AI? Now you can with tools like Disco Diffusion, an AI that generates art. Rent GPU from RunPod and start your journey on learning and managing AI models.
